


Performance of MPs from the Northeast in the 15th Lok Sabha
PRS Legislative Research *
Parliament Of India :: Pix - Wikipedia/KuwarOnline
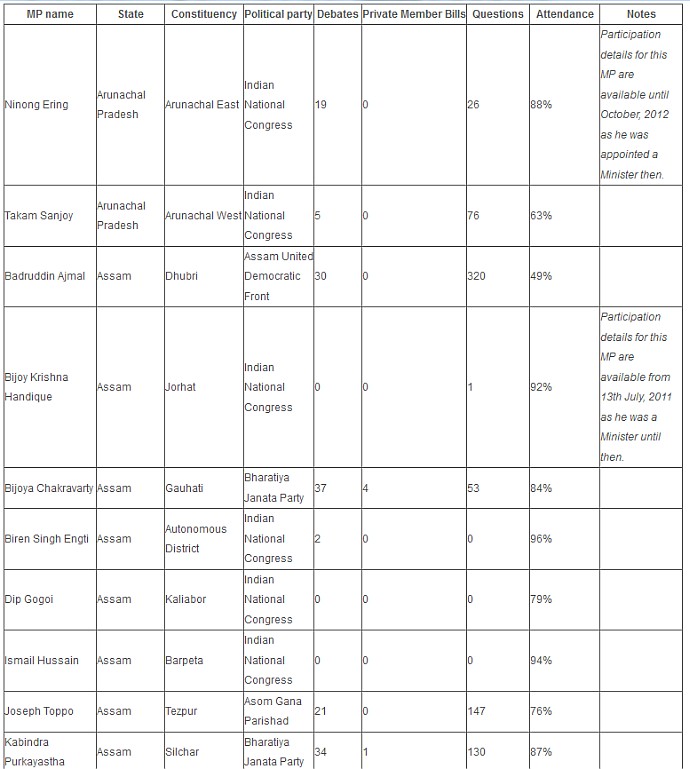
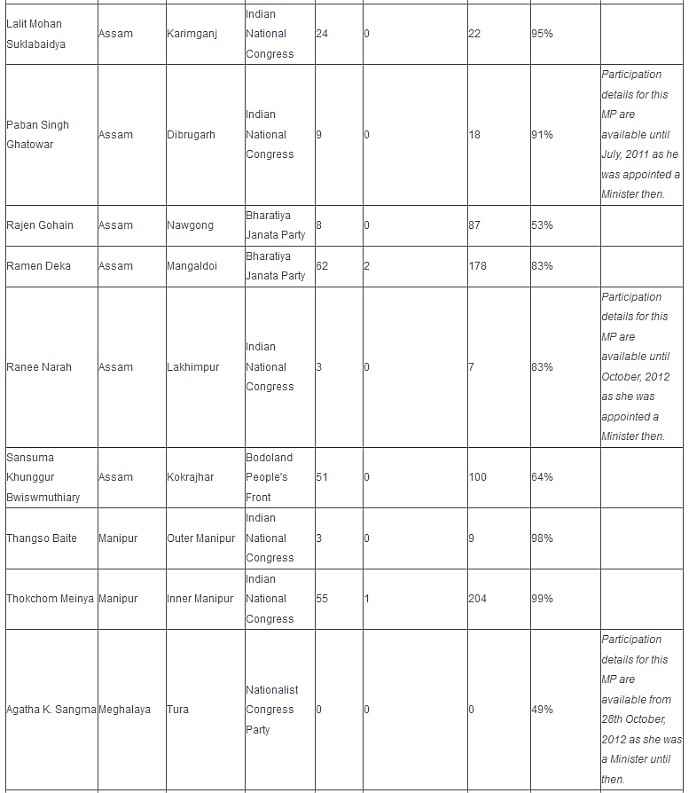
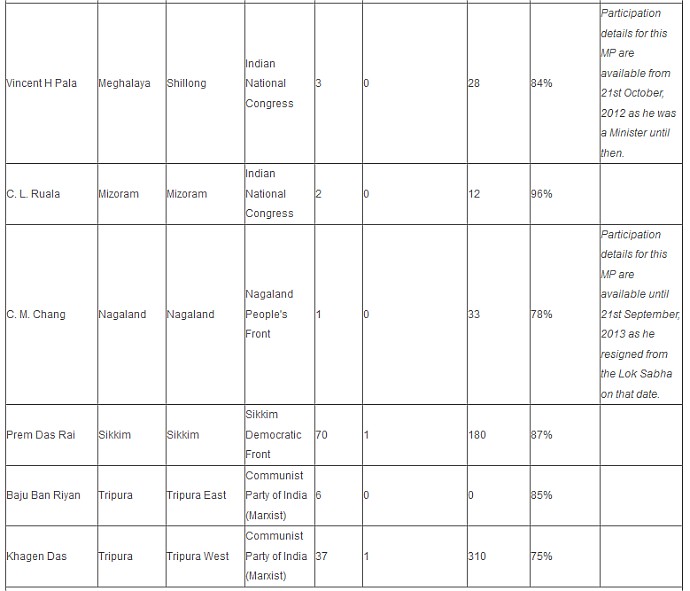
The eight Northeastern states of Arunachal Pradesh, Assam, Manipur, Meghalaya, Mizoram, Nagaland, Sikkim and Tripura have 25 constituencies between them.
Members of Parliament have four important responsibilities: to pass laws, ensure that the government performs its duties satisfactorily, represent the views and aspirations of the people of their constituency in Parliament and to approve and oversee the financial proposals of the government. Debates, Questions and Private Member Bills are important mechanisms by which MPs fulfill their responsibilities. Attendance during Parliament Sessions also indicates an MPs commitment to give effect to his role.
Below we have listed the national and state averages for Arunachal Pradesh, Assam, Manipur, Mizoram, Sikkim and Tripura. State averages are unavailable for Meghalaya and Nagaland (Meghalaya's two MPs were Ministers until 2012 while CM Chang from Nagaland resigned from Lok Sabha in 2013).
o Manipur has the highest average attendance of 98%. Most Northeastern states score higher than the national attendance average of 76%.
o P.D. Rai from Sikkim has the highest number of debates spoken (70). The national average for debates spoken is 38.
o Badruddin Ajmal has asked the most questions (320) with Khagen Das from Tripura a close second (310). The national questions average is 300.
o Bijoya Chakravarty from Assam has introduced the most number of private member bills (4). The national average for introduction of private member bills is 0.8.
| State | National Debates average | National Private Member Bills average | National Questions average | National Attendance average | State's Debates average | State's Private Member Bills average | State's Questions average | State's Attendance average |
|---|---|---|---|---|---|---|---|---|
| Arunachal Pradesh | 37.9 | 0.8 | 300 | 76% | 13.8 | 0 | 59 | 75% |
| Assam | 37.9 | 0.8 | 300 | 76% | 22.1 | 0.5 | 83 | 80% |
| Manipur | 37.9 | 0.8 | 300 | 76% | 29 | 0.5 | 107 | 98% |
| Mizoram | 37.9 | 0.8 | 300 | 76% | 2 | 0 | 12 | 96% |
| Sikkim | 37.9 | 0.8 | 300 | 76% | 70 | 1 | 180 | 87% |
| Tripura | 37.9 | 0.8 | 300 | 76% | 21.5 | 0.5 | 155 | 80% |
Source: PRS Legislative Research
Note: Data includes all MPs except Ministers. State averages are unavailable for Nagaland and Meghalaya as both the MPs from the Meghalaya were Ministers at one point and the one MP from Nagaland resigned in the middle of the term. Ministers represent the government in debates, so we do not report their participation. They do not sign the attendance register, ask questions, or introduce private member bills
Source: PRS Legislative Research
Note: Ministers represent the government in debates, and they do not sign the attendance register, ask questions, or introduce private member bills.
PRS Legislative Research
212, Gandharva Maha Vidhyalaya, 3rd Floor,
Deen Dayal Upadhaya Marg,
New Delhi 110002
India
* Shreya Singh of PRS Legislative Research sent this info to e-pao.net
The sender can be contacted at shreya(at)prsindia(dot)org
This article was posted on March 26, 2014.
* Comments posted by users in this discussion thread and other parts of this site are opinions of the individuals posting them (whose user ID is displayed alongside) and not the views of e-pao.net. We strongly recommend that users exercise responsibility, sensitivity and caution over language while writing your opinions which will be seen and read by other users. Please read a complete Guideline on using comments on this website.


